Statistics for Sports Betting Marketers
The 2026 State of Sports Betting
Comprehensive insights, performance trends, and fraud statistics shaping the next era of betting marketing.

Statistics for Sports Betting Marketers
Current Global Statistics
The global sports betting market is growing fast, driven by digital adoption, regulation, and mobile engagement. With steady double-digit growth projected through 2030, the industry continues to expand both in market value and active users.
Global sports betting market size
10–11% expected annual growth through 2030
The Upward Trend of Sporting Events
Every major event now sets a new benchmark for fan engagement. The combination of live streaming, social media interaction, and diverse representation is changing the way audiences connect with sport.
Statistics for Sports Betting Marketers
The Hidden Cost Behind Growing Sports Popularity
Across thousands of audited campaigns, a significant portion of ad spend is lost to invalid activity: bots mimicking users, repeat clicks from returning players, and low-intent traffic that inflates performance without driving conversions.
12%
Average ad spend lost to navigational traffic of returning users.
36%
Of paid traffic is invalid, from bots, repeat users, or fake clicks.
44%
Invalid traffic rate of Google search campaigns among Tier 1 operators (TrafficGuard data).
Statistics for Sports Betting Marketers
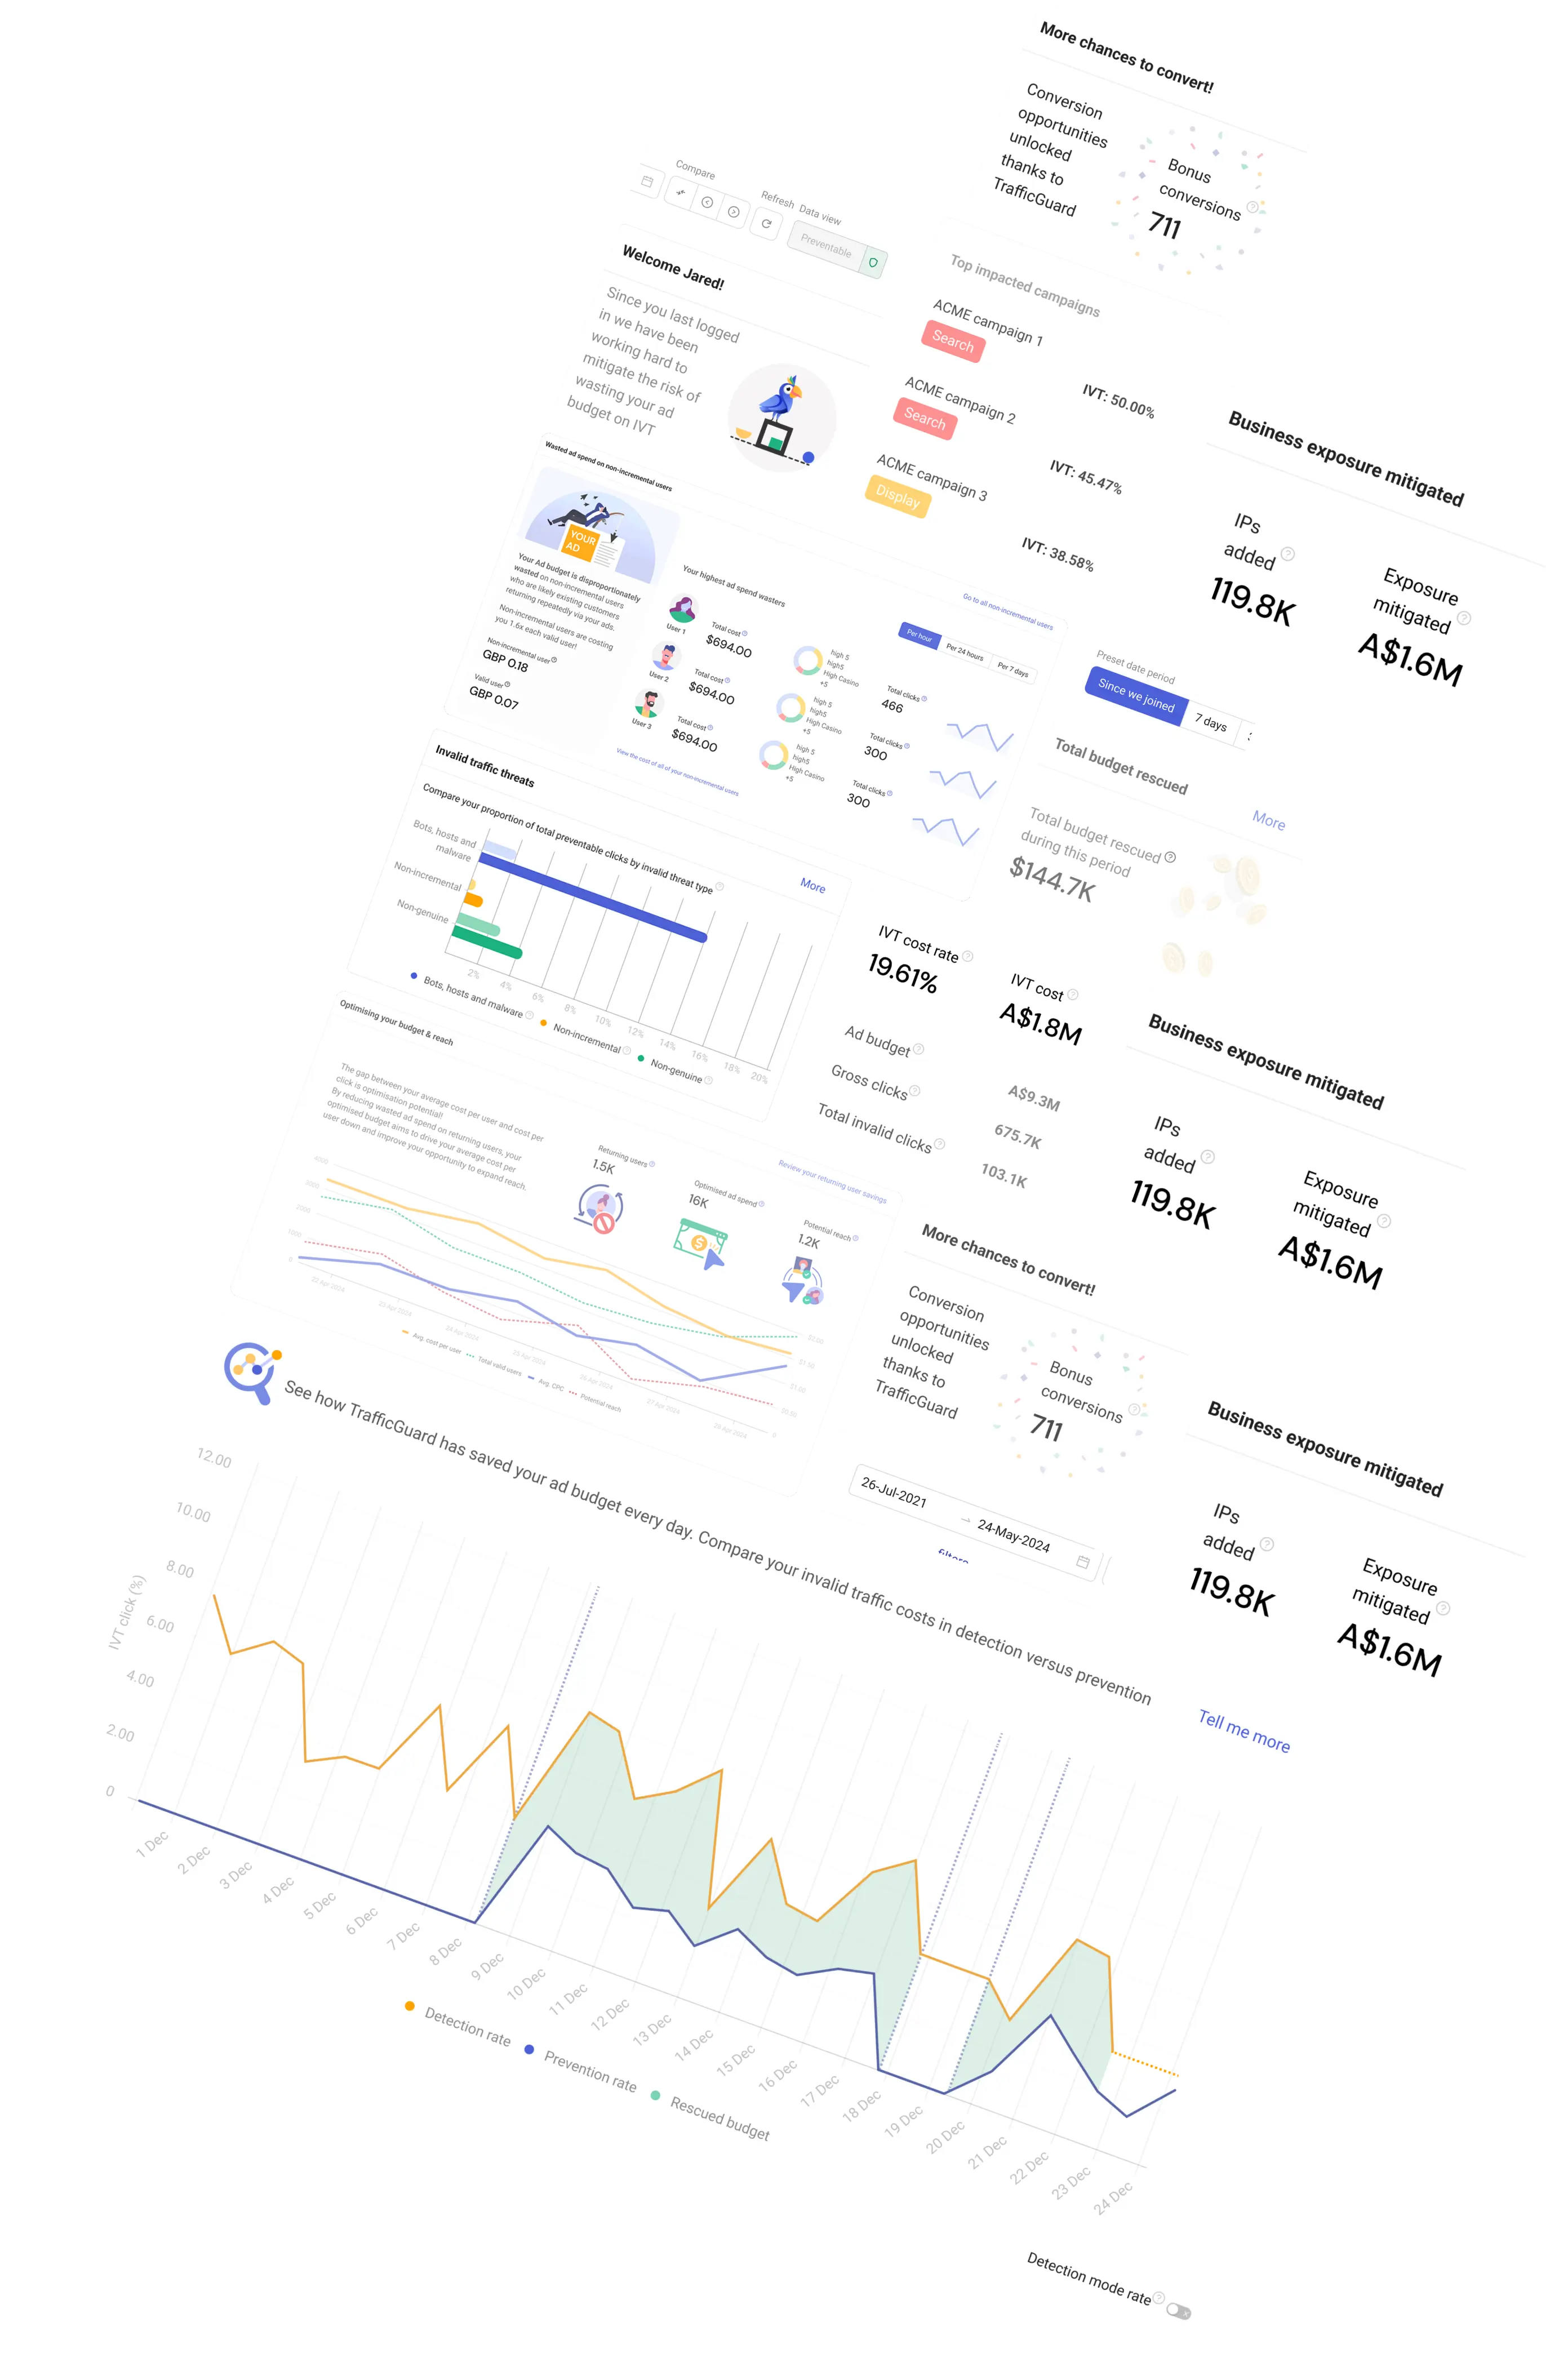
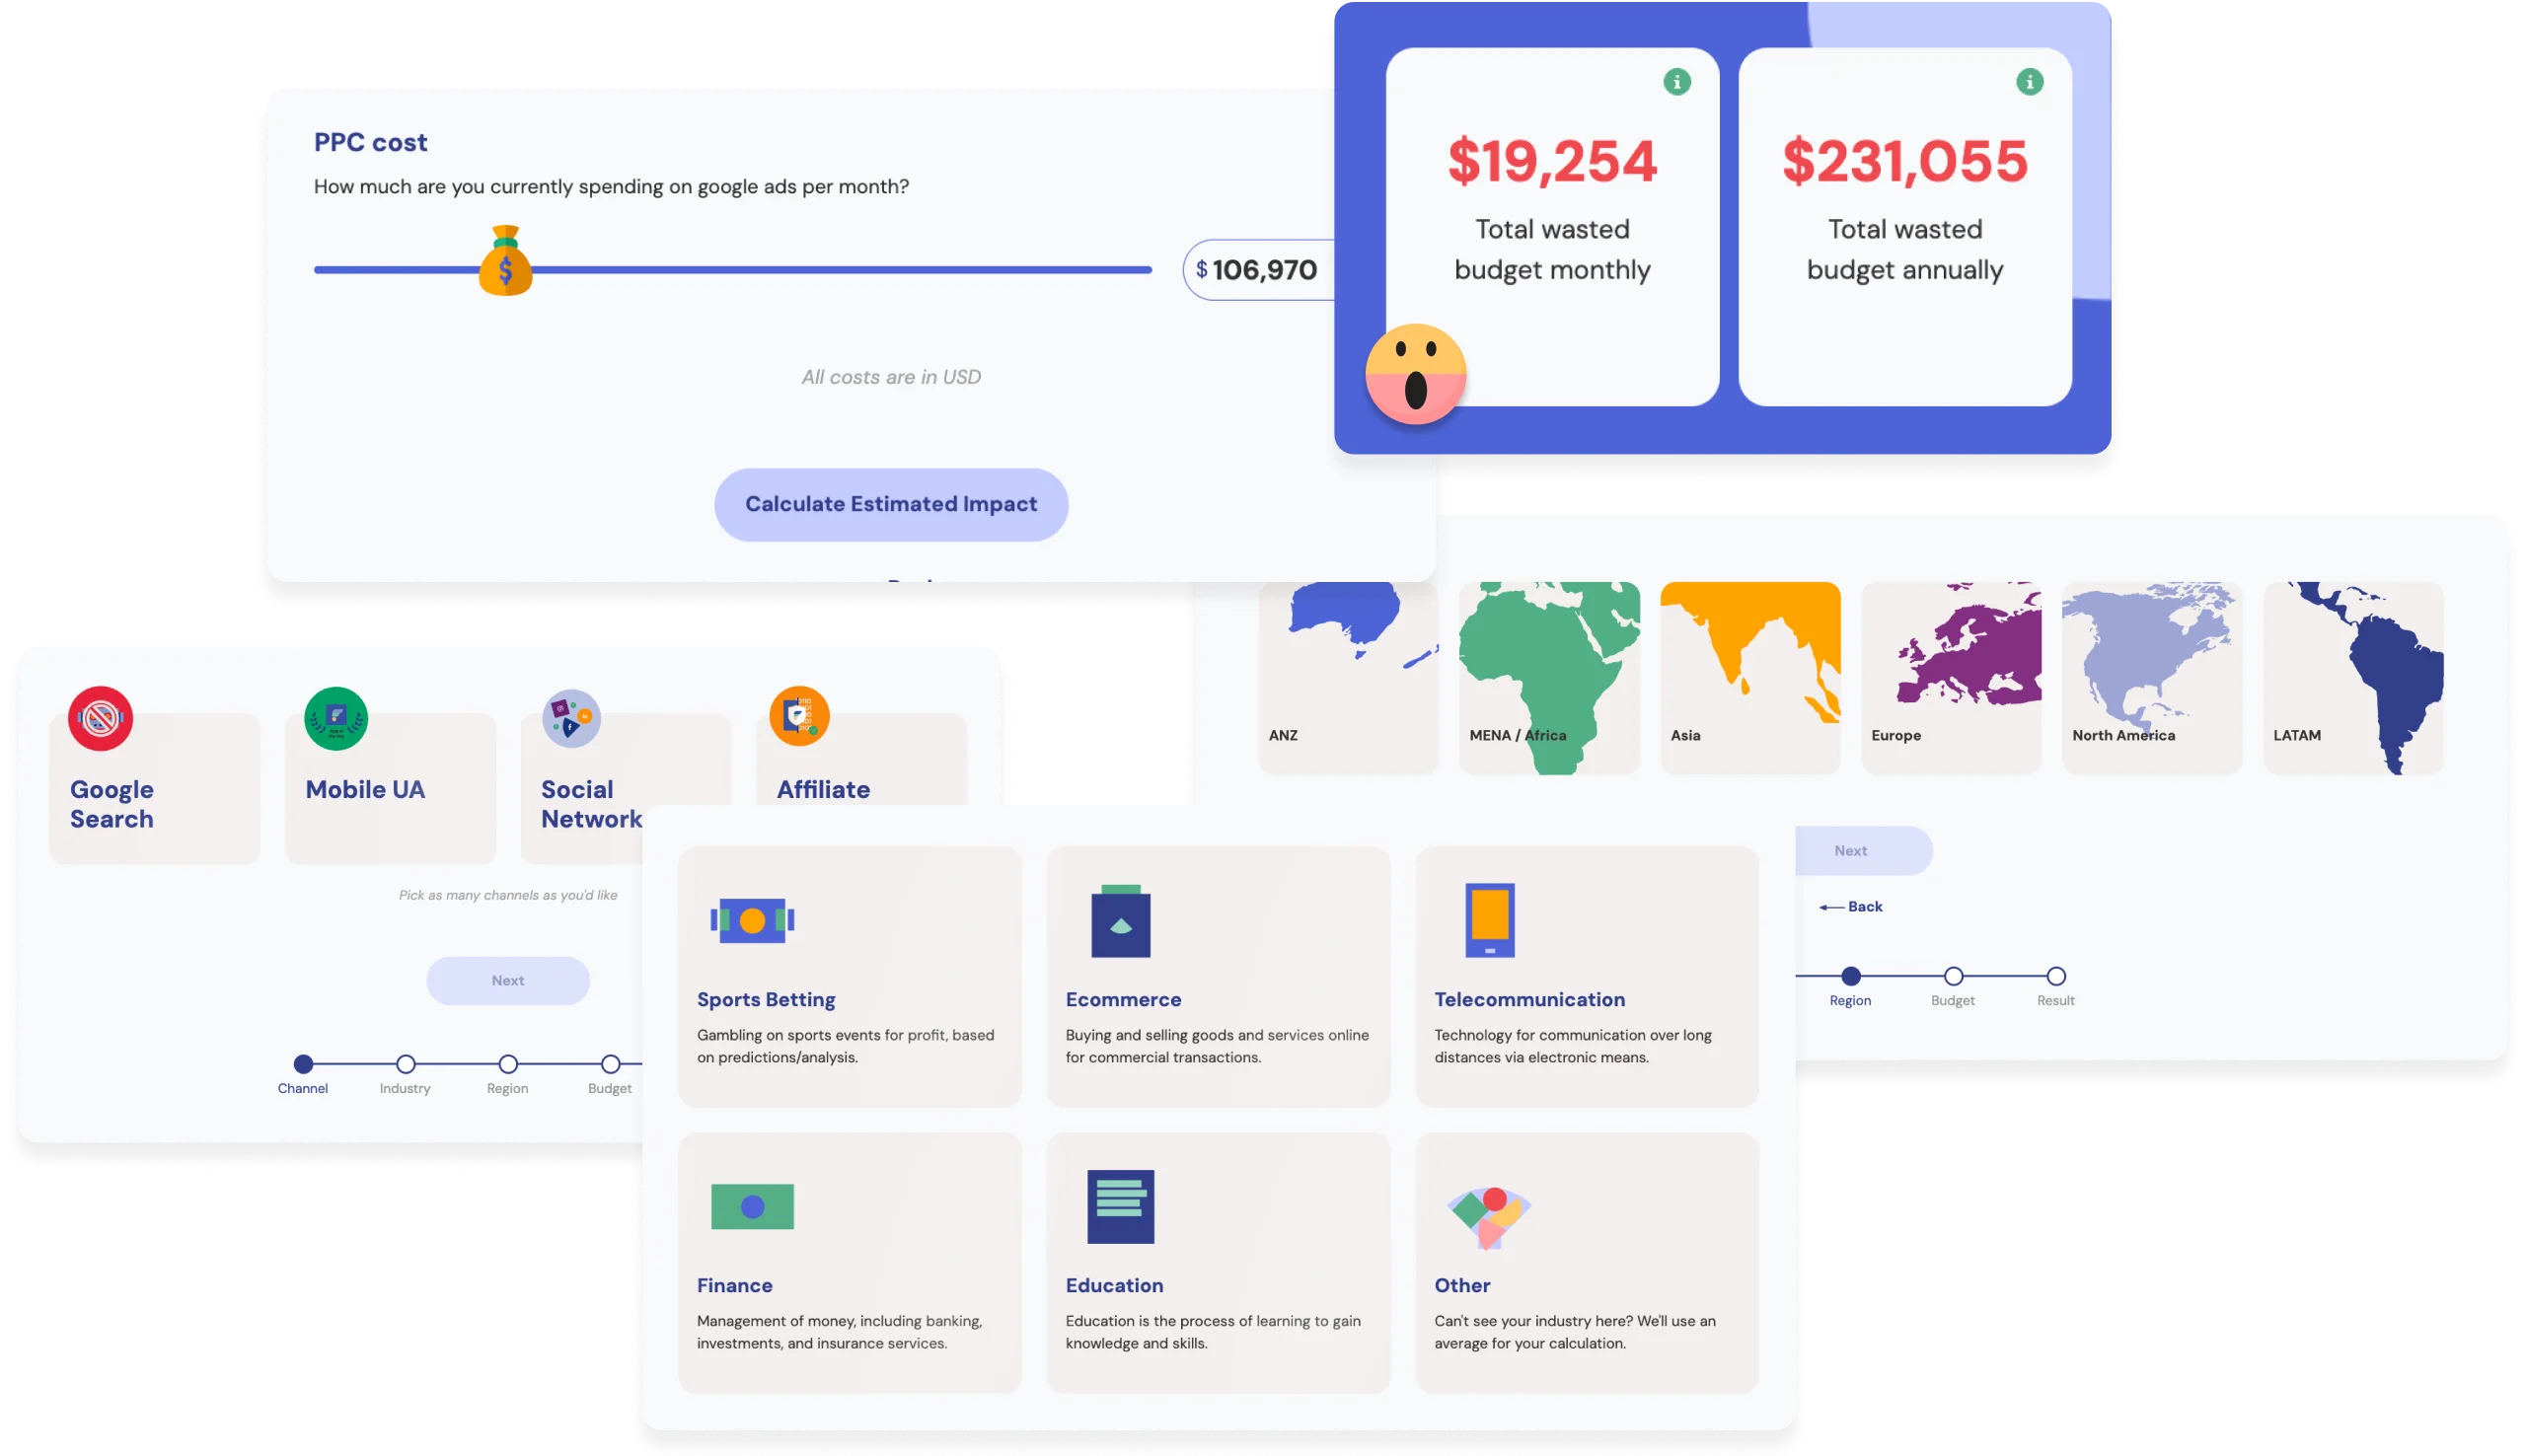
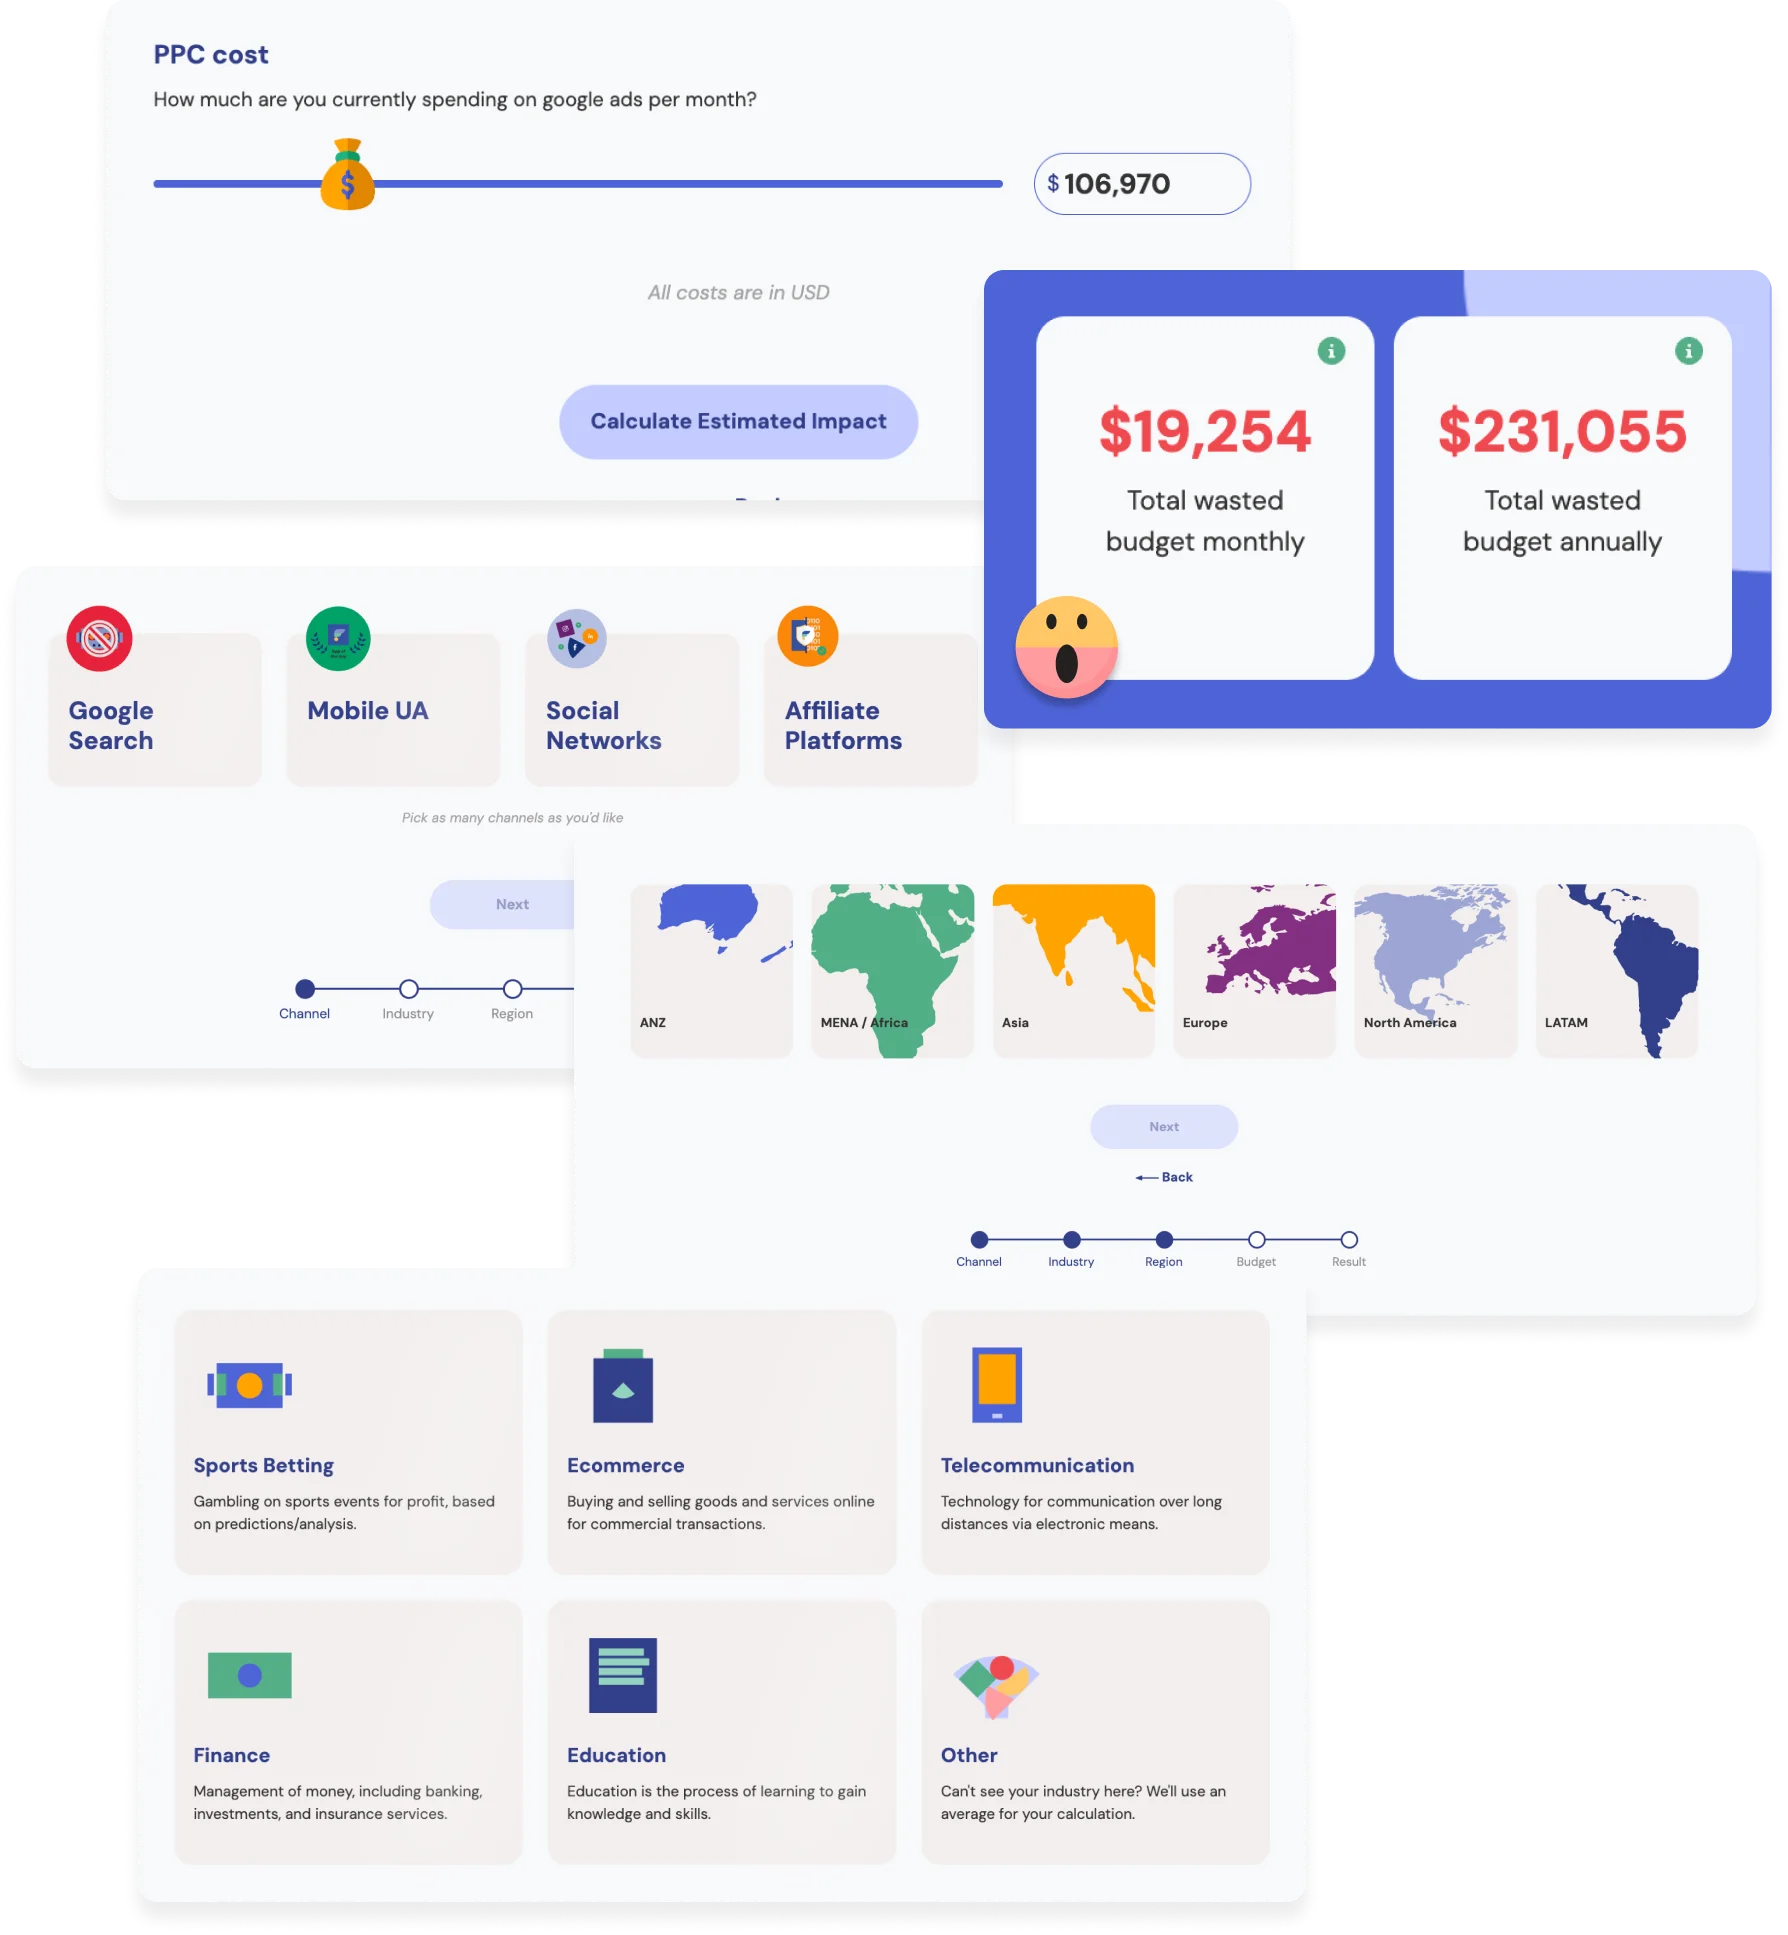
Find Out How Much Ad Spend You’re Losing to Click Fraud
Using data from more than 10,000 campaigns on the TrafficGuard platform, our IVT Calculator estimates the percentage of invalid traffic in your ads across channels, and the money it’s silently draining from your budget. See your potential savings in seconds.
FAQs on Sports Betting Statistics
Can’t find what you are looking for? Go to our support page to learn more.
What are the latest sports betting statistics marketers should know in 2026?
Recent sports betting statistics show strong global momentum, with the market valued at more than US$110 billion and continuing to grow each year. Sports betting data highlights rising participation, higher engagement during major sporting events, and consistent double-digit growth forecasts through 2030. Marketers use these statistics to understand audience demand, platform performance, and the scale of opportunities across mobile and online channels.
How should marketers analyse sports betting data to understand performance?
Analysing sports betting data involves reviewing campaign metrics alongside deeper behavioural signals. This includes sports analytics, betting trends, and performance across leagues and events. Marketers often monitor click-through rates, conversion paths, and the quality of traffic to understand whether campaigns are attracting real bettors. Clean, validated data helps ensure that insights reflect genuine user behaviour rather than inflated patterns caused by bots or repeated clicks.
What is the current growth rate of online sports betting?
Online sports betting continues to expand rapidly due to greater digital adoption, mobile accessibility, and growing interest in regulated online gambling. Industry reports show projected growth rates of 10% to 11% annually. As more online sports bettors join global platforms, competition for visibility increases and paid media performance becomes more sensitive to traffic quality and optimisation accuracy.
What risks should marketers be aware of in the sports betting industry?
Sports betting carries behavioural and financial risks, including problem gambling and exposure to high-frequency betting environments. From a marketing perspective, one of the most overlooked risks is invalid traffic. Automated systems, low-intent visitors, and repeat navigational clicks can drain budgets without driving conversions. Understanding these risks allows marketers to plan campaigns that balance responsible gambling expectations with accurate acquisition performance.
How do betting odds and market types influence user engagement?
Betting odds shape how bettors interact with different sports, leagues, and event types. Competitive odds, live markets, and micro-betting formats often attract higher engagement. Market depth and real-time pricing influence how users move between betting options. Insights from betting statistics help marketers identify which markets generate the strongest interest and where campaign spend is most effective.
How does sports betting activity affect financial outcomes for bettors and operators?
Sports betting affects personal finances through individual betting behaviour, frequency, and risk tolerance. Gambling statistics show that users who wager frequently or on volatile markets may experience higher financial exposure. For operators, financial performance is closely tied to marketing efficiency and the accuracy of campaign data. Invalid traffic can distort acquisition costs, weaken optimisation models, and reduce the effectiveness of budget allocation.
What do current demographics show about online sports bettors in 2026?
Sports betting demographics continue to shift as the industry grows. Adults aged 21 to 44 remain the most active group, but participation is increasing across gender and age segments. Sports betting surveys show a rise in female engagement, driven by growing viewership in women’s sports. Younger bettors tend to favour mobile-first experiences and in-play betting, while older audiences often prefer traditional markets. These demographic patterns help marketers refine targeting and audience strategies.
Why is invalid traffic a growing concern for sports betting marketers?
Invalid traffic is increasing due to heavier competition, event-driven spikes, and the complexity of digital acquisition. Bots, fake clicks, and repeated traffic from returning users can distort results and inflate CPCs. TrafficGuard data shows that some Google Search campaigns among Tier 1 operators see invalid traffic rates of more than 40%. Identifying this activity early helps marketers maintain accurate reporting and ensures budgets reach users who are genuinely interested in betting.
How can marketers estimate how much ad spend is being lost to invalid traffic?
Marketers can estimate potential budget loss by analysing click patterns, device signals, user frequency, and anomalies across their campaigns. Tools such as TrafficGuard’s IVT Calculator use aggregated data from thousands of sports betting campaigns to estimate the percentage of invalid traffic affecting performance. This provides a quick, high-level view of how much spend may be lost to bots, repeated clicks, or low-intent traffic.
What insights can sports betting marketers gain from major global sporting events?
Major events such as football tournaments, motorsport seasons, and global championships drive some of the highest engagement spikes of the year. Event-driven statistics show increases in viewership, betting activity, and real-time interaction across digital platforms. While this creates strong acquisition opportunities, it also attracts increased automated activity. Analysing these patterns helps marketers plan budgets, protect campaigns from invalid traffic, and optimise spend around the moments that matter most.
Sign Up To Our Newsletter