
What Is ROAS? The Complete Guide to Return on Ad Spend in 2026
Advertisers lose an estimated $250 billion a year to ad fraud. Most ROAS reports never account for it. Return on Ad Spend is the metric that connects every pound of advertising investment directly to revenue generated. When performance teams evaluate whether campaigns are profitable, scalable, or worth further budget, ROAS is the first number on the table.
But ROAS is also one of the most misread metrics in performance marketing. Marketers calculate it against an incomplete cost base, benchmark it without margin context, and optimise from data that fraud has already corrupted. The gap between reported ROAS and real ROAS is where the budget disappears silently.

This blog covers everything: the correct formula, industry benchmarks, the ROAS vs. ROI distinction, and how invalid traffic protection sits at the foundation of any credible ROAS strategy.
Reliable data starts with clean traffic. Everything else follows.
ROAS Definition: What Does Return on Ad Spend Mean?
Return on Ad Spend measures the revenue generated for every unit of advertising spend. It answers one commercially essential question: how much revenue does each pound of advertising produce?
ROAS is used across every major paid acquisition channel: Google Ads, Meta, Amazon Ads, affiliate programmes, and programmatic display. Because it connects cost directly to revenue, it is the first metric performance marketers reach for when evaluating whether a campaign is working.
The ROAS Formula: How to Calculate Return on Ad Spend
The calculation is straightforward:
ROAS = Revenue generated from advertising ÷ Advertising spend
Example: A campaign generating $8,000 in revenue from $2,000 in spend produces a 4:1 ROAS. Four dollars of revenue for every pound spent. The formula is simple. Getting reliable inputs is not. Accurate ROAS depends on correct conversion tracking, clean attribution, and a complete cost denominator. Compromise any of those and the figure becomes misleading.
ROAS as a Ratio vs. a Percentage: Which Should You Use?
ROAS can be expressed as a ratio (4:1) or a percentage (400%). Both describe the same result. Ratio format is standard practice among performance marketers because it is easier to compare across channels and time periods at a glance. Keep the format consistent across stakeholders to avoid confusion.
What Costs Should Be Included in Your ROAS Calculation?
The most common ROAS calculation error is using media spend alone as the denominator. A complete view requires all costs associated with running advertising activity:
- Media spend across platforms
- Agency or campaign management fees
- Creative production costs
- Marketing technology and optimisation tools
Excluding these costs flatters the headline figure. For businesses making budget allocation decisions, an incomplete denominator leads to overconfident investment in campaigns that may not be as profitable as they appear.
What Is a Good ROAS? Benchmarks by Industry and Channel
There is no single universal benchmark for a good ROAS. The right number depends on product margins, customer acquisition costs, competitive dynamics, and business model. A retailer operating on 10% margins needs a fundamentally different ROAS to remain profitable than a SaaS business running at 80% gross margin. That said, benchmarks provide a useful reference point.
Average ROAS Benchmarks: What the Data Says

Good ROAS for Google Ads, Meta, and Programmatic Display
Google Search Ads capture users actively searching for a product or service. That intent advantage translates into stronger conversion rates and, typically, stronger ROAS than awareness-focused channels.
Meta Ads tend to operate earlier in the buying cycle. Direct-response ROAS may appear lower, but these campaigns frequently drive demand that converts through other channels later. Last-click attribution significantly undervalues their contribution.
Programmatic display is primarily a brand-building channel. Expecting direct-response ROAS benchmarks here misunderstands its role. Evaluate it alongside viewability, reach, and assisted conversion data.
What Does a 3x ROAS Mean, and Is It Enough?
A 3:1 ROAS means the campaign generates three pounds of revenue for every pound spent. Whether that is sufficient depends entirely on margins. A retailer at 20% margin is almost certainly losing money. ROAS is a performance signal, not a profitability guarantee. Always evaluate it alongside margin data and customer lifetime value.
ROAS vs. ROI: What's the Difference and When to Use Each
Why ROAS and ROI Are Often Confused
Both metrics involve revenue and cost, which is where the confusion starts. The difference lies in scope. ROAS measures revenue relative to advertising spend only. ROI measures profit relative to all business costs: production, fulfilment, operations, and overheads.
A campaign can show an impressive 6:1 ROAS while still generating limited profit if product margins are thin and operational costs are high. Reporting ROAS to leadership without the margin context creates a misleadingly optimistic picture of campaign health.
When ROAS Is the Right Metric (and When It Isn't)
ROAS is the right metric when evaluating individual campaign performance, comparing channel efficiency, or deciding where to scale spend. It is not the right primary metric for assessing long-term business profitability, or for campaigns where customer lifetime value significantly exceeds first-purchase revenue.
Subscription businesses, financial services, and SaaS companies should be cautious about optimising purely for ROAS on acquisition campaigns. A customer acquired at modest initial ROAS who retains for three years is worth far more than the first transaction suggests.
ROAS vs. CPA vs. MER: The Full Picture of Ad Efficiency

Why ROAS Matters: The Business Impact of Return on Ad Spend
ROAS and Budget Allocation: Spending Smarter, Not More
When one campaign consistently produces 5:1 ROAS and another delivers 2:1, the decision about where to shift the budget should be clear. In practice, this reallocation is often delayed because data is incomplete, misread, or distorted. Reliable ROAS data is the foundation of disciplined budget management. Without it, you are optimising blind.
ROAS and Customer Lifetime Value: The Long-Term View
For businesses with recurring revenue, initial ROAS figures frequently understate the true value of a campaign. A campaign delivering 2:1 ROAS on first purchase may be extremely profitable once 12-month or 24-month customer revenue is factored in. Marketers who optimise purely on first-transaction ROAS often underspend on high-value acquisition campaigns and overspend on those that produce low-retention customers.
How ROAS Drives Campaign Performance and Marketing Strategy
ROAS shapes strategy at every level. At the campaign level, it signals where to scale and where to cut. At the channel level, it drives media mix decisions. At the executive level, it translates advertising activity into revenue language that boards and finance teams understand.
The teams that use ROAS most effectively treat it as a directional signal, not an absolute truth. They combine it with margin data, attribution analysis, and traffic quality reporting to build a complete picture of advertising efficiency.
The Silent ROAS Killer: How Invalid Traffic Corrupts Your Data
Most advertisers assume their ROAS metrics accurately reflect campaign performance. Many are wrong. Invalid traffic and ad fraud quietly distort these numbers, and standard reporting tools rarely surface the problem.
Industry research estimates that up to 22% of global advertising spend is wasted on invalid traffic each year, representing tens of billions in budget consumed by activity that produces no genuine customers. The consequence is not just wasted spend. It is decisions made on corrupted data, optimisation signals that lead in the wrong direction, and a ROAS figure that looks acceptable while real returns are substantially lower.
The Many Forms of Invalid Traffic: Beyond Click Fraud
Click fraud is the most widely recognised form of invalid traffic, but it is far from the only one. Performance marketers need to understand the full spectrum of IVT that can corrupt ROAS data:
- Click fraud: Automated bots, competitors, or malicious actors generating artificial clicks. Cost rises without corresponding revenue.
- Excessive clickers: Real users who click on ads compulsively or repeatedly without genuine purchase intent. These inflate cost-per-click averages and pollute conversion funnel data.
- Navigational traffic: Users who type branded URLs or search terms into ad slots rather than the address bar, generating accidental clicks with near-zero purchase intent.
- Data centre traffic: Automated traffic originating from cloud infrastructure and server farms, mimicking human behaviour at scale.
- Fake impressions: Bot-generated views in programmatic campaigns that inflate reach metrics without genuine audience delivery.
- Automated engagement: Traffic that mimics real user behaviour, distorting quality signals used by bidding algorithms.
- Attribution manipulation: Redirects conversion credit away from campaigns that genuinely drove the sale, distorting spend decisions.
Each of these inflates reported metrics, makes campaigns appear more effective than they are, and results in budgets being directed toward inventory or audiences delivering no real commercial value.
How Click Fraud Inflates Your Ad Costs and Suppresses ROAS
Click fraud occurs when automated bots, competitors, or malicious actors generate artificial clicks on ads. These clicks increase advertising spend without producing genuine conversions. Revenue stays flat. Cost rises. ROAS declines. In high-competition verticals where CPCs are already elevated, even a modest volume of fraudulent clicks has a measurable impact on returns. Understanding the relationship between click fraud and ROAS is not optional for performance marketers. It is a prerequisite for accurate reporting.
Why Your ROAS Looks Fine but Your Real Return Is Much Lower
The most dangerous aspect of invalid traffic is its invisibility within standard reporting dashboards. Platform-reported ROAS can appear healthy while a substantial portion of ad spend is consumed by non-human traffic.
When invalid traffic drains your ad budget, you are not just losing the wasted spend. You are losing the opportunity cost of what that budget could have generated in genuine, convertible traffic.
According to TrafficGuard, up to 25% of ad spend across some verticals reaches invalid traffic. For a $500,000 annual paid media budget, that is $125,000 generating nothing. Use our Click Fraud Calculator for Invalid Traffic to estimate the gap between your reported and real ROAS based on your own spend and vertical.
The ROAS your dashboard shows and the ROAS you are actually achieving are two different numbers. The difference is invalid traffic.
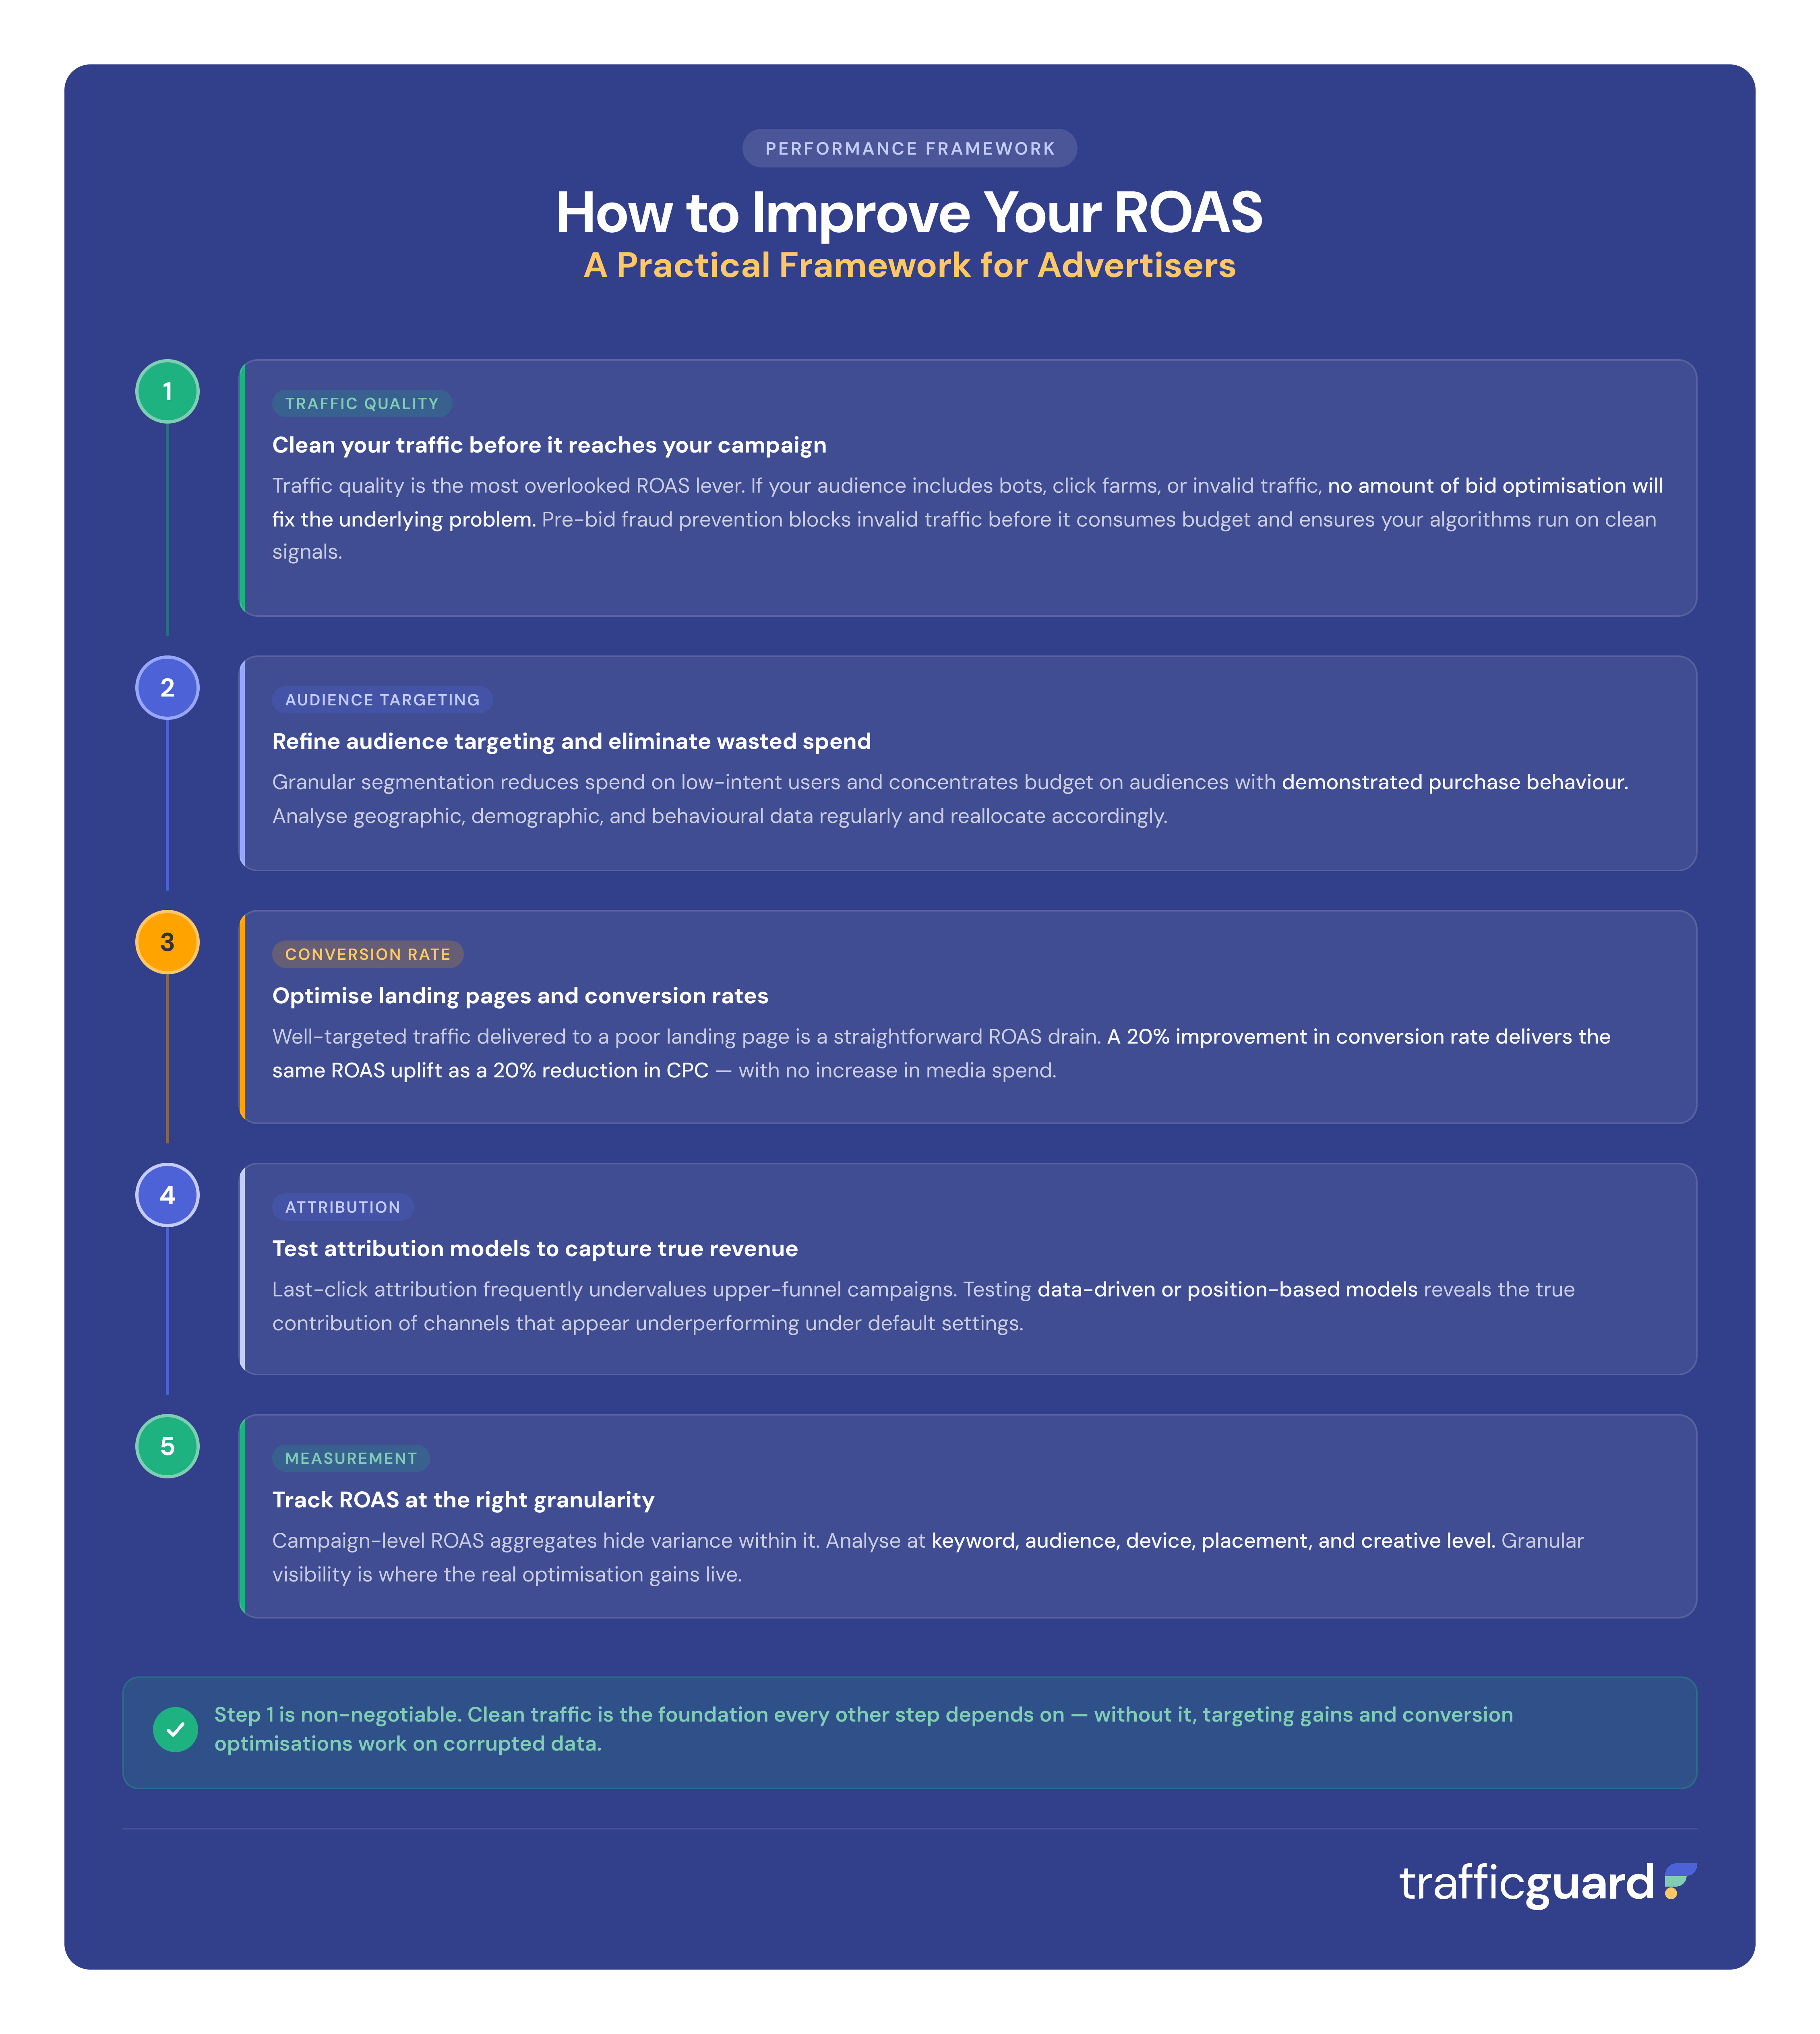
How to Improve Your ROAS: A Practical Framework for Advertisers
Improving ROAS requires disciplined optimisation across the full campaign stack: traffic quality, targeting, creative, conversion experience, and measurement. These five steps address the levers that most performance teams underutilise:
How to Track ROAS on Google Ads and Meta in 2026
Accurate ROAS tracking depends entirely on correct conversion tracking configuration within each platform. Platform interfaces evolve continuously; text-based implementation guidance is more durable than screenshot walkthroughs that go stale within months.
Setting Up ROAS Tracking in Google Ads
Enable conversion tracking within your account settings and assign revenue values to conversion actions. Implement the global site tag and event snippets on the relevant pages, then verify that conversions are recording accurately within campaign dashboards before relying on the data for optimisation decisions.
For campaigns running Target ROAS bidding, accurate conversion values are essential: the bidding algorithm uses these values to make real-time bid decisions. Before scaling spend, ensure you protect your Google Ads campaigns from invalid traffic that distorts the conversion data your bidding strategy depends on.
Tracking ROAS in Meta Ads Manager
Meta Ads Manager calculates purchase ROAS automatically when revenue values are passed through conversion events. Ensure the Meta Pixel or Conversions API is correctly installed, that purchase events include accurate revenue parameters, and that your attribution window settings reflect your typical customer buying cycle. Review event quality in the Events Manager before drawing conclusions from ROAS data.
Frequently Asked Questions
What is ROAS and how is it different from ROI?
ROAS measures the revenue generated per pound of advertising spend: divide revenue by ad cost and you have your ratio. ROI is broader; it measures net profit against all business costs, including production and fulfilment. A campaign can show strong ROAS while still being unprofitable if product margins are thin. Use ROAS to evaluate campaign efficiency, and ROI to assess overall business profitability.
What is a good ROAS for e-commerce and paid search?
For e-commerce, a 4:1 to 6:1 ROAS is a commonly cited target, though the right number depends entirely on your gross margin. Google Search Ads frequently deliver 2:1 to 8:1 depending on category and competition. The benchmark that matters most is the one at which your campaigns remain profitable after all costs are accounted for.
How does Target ROAS bidding work in Google Ads?
Target ROAS (tROAS) is a Smart Bidding strategy that sets bids automatically to achieve your specified return on ad spend. The algorithm uses historical conversion data, device signals, and audience behaviour to optimise bids in real time. It requires accurate conversion values and sufficient conversion volume to perform reliably. Invalid traffic that inflates conversion counts or skews revenue data will cause tROAS to optimise in the wrong direction.
How much of my ROAS could be distorted by invalid traffic?
Industry estimates suggest up to 22% of global ad spend reaches invalid traffic. In some verticals the figure is higher. The practical impact on ROAS depends on how much of your traffic is non-human: bots drive up cost while generating no revenue, directly suppressing your return. Use TrafficGuard's IVT Calculator to get a clearer picture of the gap between your reported and real ROAS.
What is the fastest way to improve ROAS without increasing spend?
Improving traffic quality delivers immediate ROAS gains with no additional media cost: removing invalid traffic from your campaigns reduces wasted spend and cleans the conversion data your bidding algorithms depend on. Beyond that, landing page conversion rate optimisation and audience refinement are the next highest-leverage levers. A 15 to 20% improvement in conversion rate typically produces a proportional improvement in ROAS.
Which attribution model gives the most accurate ROAS data?
No attribution model gives you accurate ROAS data if the underlying conversion signals are corrupted. This is not a model selection problem; it is a data integrity problem.
Invalid traffic generates fake engagement that gets recorded as real conversion touchpoints. Your attribution model then credits those touchpoints as if they drove genuine revenue, misallocating budget toward channels that never produced a real customer. Whether you are using last-click, linear, or data-driven attribution, the output is only as reliable as the signals feeding it.
Data-driven attribution is the most accurate model where conversion volume supports it, but clean traffic is the prerequisite. TrafficGuard filters invalid traffic before it enters your conversion funnel, so the signals your attribution model reads reflect real user behaviour, and your ROAS reflects real performance. See how invalid traffic distorts attribution in practice: How Fraud Traffic Is Draining Your Ad Budget.
When should I optimise for CPA instead of ROAS?
CPA is the more appropriate optimisation target when conversions do not have a direct revenue value: lead generation, app installs, free trial sign-ups, and subscription models where initial conversion value does not represent full customer value. ROAS is the right target when conversions carry known revenue values and your goal is to maximise revenue relative to spend.
Why does ROAS fluctuate and how do I account for seasonality?
ROAS fluctuates because the variables that drive it change: competition for inventory shifts CPCs, audience intent varies by time of year, and conversion rates respond to promotions, stock availability, and market conditions. Seasonal peaks typically compress margins on ROAS because CPCs rise faster than conversion rates. Set ROAS targets that account for these patterns, track rolling averages rather than single-week snapshots, and avoid making structural campaign changes during periods of expected volatility.
Get started - it's free
You can set up a TrafficGuard account in minutes, so we’ll be protecting your campaigns before you can say ‘sky-high ROI’.

Explore More Blogs


Subscribe
Subscribe now to get all the latest news and insights on digital advertising, machine learning and ad fraud.


